
 - EN
 - EN
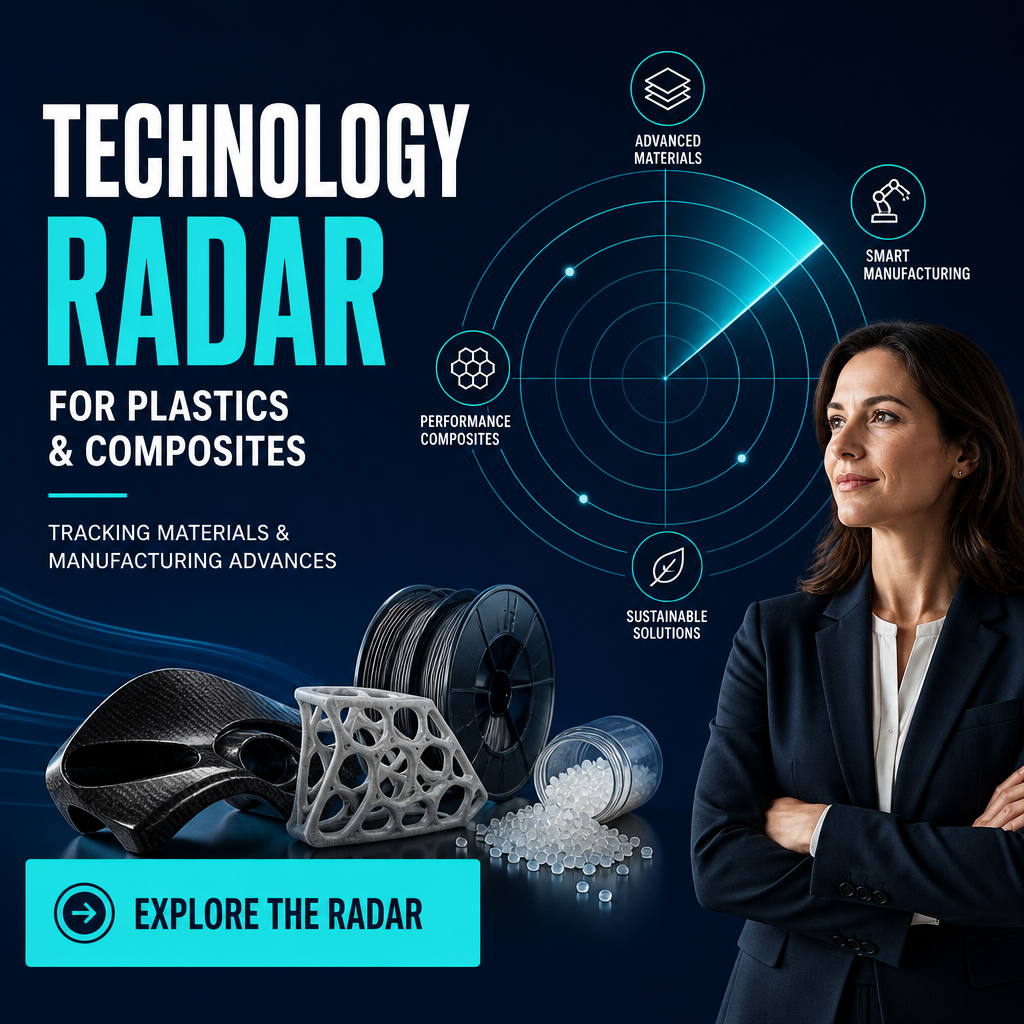
Why external change should drive your next experiment:
Plastics and composites teams are often outstanding at solving today’s molding and performance issues—warpage, shrinkage, dimensional drift, surface quality, strength, and scrap—but too busy to continuously monitor what competitors, adjacent industries, open-source communities, and researchers are doing next. A Technology Radar turns external change into an organized R&D input.
For processors, molders, and composite fabricators, this matters because the next improvement in repeatability or lightweighting frequently comes from outside your four walls: a new resin system that shifts cure behavior, a tooling surface treatment that changes release and gloss, a simulation method that better predicts fiber orientation, or a process-window optimization technique borrowed from another sector. The search intent behind “Technology Radar for Plastics & Composites: Tracking Manufacturing Advances” is simple: what should your company be watching now so your next product or process decision is informed by emerging technology—not only internal experience.
A practical Technology Radar model for plastics and composites teams:
A Technology Radar is a lightweight system for collecting, filtering, and converting external signals into internal action. It works best when it is anchored to a few recurring technical objectives that define success in plastics and composites manufacturing:
1) Dimensional stability: warpage, shrinkage, post-mold movement, tolerance stack-up
2) Mechanical performance: strength-to-weight, impact, fatigue, creep, interlaminar shear
3) Surface and appearance: sink, flow lines, gloss, fiber print-through, paint adhesion
4) Process robustness: scrap, cycle time, repeatability, rework, Cp/Cpk
5) Cost and supply resilience: material substitution, additive/package changes, recycled content variability
A useful Radar runs in a recurring cadence—monthly scan, quarterly synthesis, and a backlog of testable hypotheses for Product Development. It’s not a trend report; it’s a decision tool that converts “what changed externally” into “what we should test next.”
Within SHAIN’s GUIDE → SOLVE → FUND framework:
– GUIDE identifies where materials and manufacturing technology is moving.
– SOLVE uses that intelligence to design experiments that reduce technical uncertainty.
– FUND captures that qualifying experimentation through R&D Tax Credits.
Radar categories that matter most: materials, tooling, process-window, and verification methods:
A Technology Radar for Plastics & Composites should be organized around categories that directly influence warpage, fiber orientation, cure behavior, and repeatability.
Materials and formulations to watch:
– Resin and polymer development (new copolymers, tougheners, high-heat grades, low-warp formulations)
– Composite matrix systems (epoxies, BMI, thermoplastic composites; out-of-autoclave chemistries)
– Reinforcement changes (fiber sizing, hybrid fabrics, recycled fiber, tailored preforms)
– Additives and fillers (nucleating agents, conductive fillers, flame retardants, mineral loading effects)
– Recycled and bio-based content (batch-to-batch variability that affects shrinkage and strength)
Manufacturing and tooling advances to watch:
– Injection molding process controls (advanced pressure/temperature sensing, cavity balancing methods)
– Tooling optimization (cooling channel strategies, conformal cooling, venting improvements)
– Composite layup innovations (automated layup/placement methods, compaction strategies)
– Cure-process development (ramp/soak profiles, dielectric cure monitoring, post-cure optimization)
– Process-window optimization methods (robust DOE approaches and statistically defensible ranges)
Verification and prediction methods to watch:
– Warpage/shrinkage and residual stress prediction improvements
– Fiber orientation and anisotropy modeling tied to mechanical testing
– Dimensional metrology workflows that shorten iteration cycles
These categories keep the Radar grounded in what plastics and composites leaders actually get measured on: scrap, cycle time, mechanical performance, and dimensional stability.

“I call it think with AI and work with people.”
– Satya Nadella, Chairman and CEO of Microsoft
Competitive benchmarking: turning competitor output into engineering inputs:
Technology Radar is incomplete without competitive benchmarking. In plastics and composites, benchmarking is less about copying features and more about understanding technical tradeoffs.
A disciplined benchmarking approach can reveal:
– Performance gaps: stronger parts at the same weight; lower warp at the same cycle time
– Feature gaps: surface quality and paint adhesion that reduce secondary operations
– Engineering approaches: gating, venting, tool temperature strategy, cure cycle philosophy
– Technical tradeoffs: stiffness vs. impact; cycle time vs. dimensional stability; recycled content vs. repeatability
– “Hidden process” signals: consistent gloss and flatness may imply better thermal management or material conditioning
Example benchmarking questions your team should be able to answer:
– If a competitor holds tighter flatness, is it material substitution, tooling changes, or process-window controls?
– If a competitor’s composite panel shows less fiber print-through, is it resin rheology, layup compaction, or cure profile?
– If their scrap rate is lower, what does that suggest about sensing, control plans, or material lot qualification?
An AI R&D CTO or Virtual CTO can structure this benchmarking so it stays engineering-led: define measurable targets (warp, shrinkage, strength, surface defects), collect signals, and translate them into testable hypotheses rather than generic “market research.”
Scenario: resin and additive trials to reduce warpage and shrinkage without sacrificing cycle time:
Warpage and shrinkage are rarely solved by a single variable. A Radar approach helps your team watch for external developments that change the next experiment you run.
Scenario lens:
– You’re seeing unacceptable warpage on a ribbed housing and chasing it with hold pressure and pack time, but dimensional stability varies by lot.
Radar-driven experiment design:
– Materials signals: a new low-warp resin grade, alternative filler packages, or a nucleating agent approach that changes crystallization behavior.
– Methods signals: improved approaches to measuring residual stress or more accurate shrinkage inputs for simulation.
Practical next steps:
– Run controlled resin/additive trials focused on technical uncertainties: which material formulation reduces warp while maintaining strength and surface quality?
– Capture process-window boundaries: what range of melt temperature, mold temperature, and cooling time provides repeatable flatness?
If your team is performing systematic trials aimed at resolving technical uncertainty and improving performance, these may be Qualified Research Activities (QRAs) for R&D Tax Credits—especially when you document hypotheses, test plans, iterations, and results.
Scenario: tooling optimization and cooling strategy changes to hold dimensions and reduce scrap:
Tooling optimization is often the fastest path to repeatability, but it’s also where teams can burn weeks without a clear learning plan.
Scenario lens:
– A part meets tensile requirements but fails dimensional stability, and scrap increases when the press schedule changes.
Radar and benchmarking inputs:
– External signals to watch: conformal cooling methods, new thermal interface coatings, venting design practices, and sensor-driven cavity pressure controls.
– Competitive signals: tighter dimensional stability may indicate superior heat extraction strategy or more robust control of viscosity shifts.
SOLVE-style experimentation:
– Iteratively test cooling channel modifications or process controls that reduce warpage and shrinkage.
– Use DOE to isolate interactions (mold temperature × hold pressure × cooling time) and establish a stable process window.
From an R&D Tax Credit perspective, these iterative trials can support a Research and Development Tax Credits position when they are intended to eliminate technical uncertainty (not routine production tuning) and when you retain contemporaneous technical records of what you tested and what you learned.
Scenario: composite layup and cure-process development to improve strength-to-weight and surface quality:
Composite layup and cure-process development is a prime area for Technology Radar because small changes in materials, compaction, and cure behavior can create large changes in mechanical performance and appearance.
Scenario lens:
– You need improved strength-to-weight but are fighting porosity, dimensional drift, or fiber orientation variability.
Radar categories to prioritize:
– Matrix system changes that improve flow and wet-out without degrading heat resistance
– Cure monitoring methods that improve repeatability and reduce under/over-cure risk
– Layup strategies that reduce wrinkling and improve fiber alignment
Experimentation examples:
– Compare layup sequences or compaction strategies to improve dimensional stability.
– Optimize cure ramps/soaks to reduce residual stress and improve surface quality.
This type of systematic experimentation is often eligible as Qualified Research Activities, and the associated labor, supplies used in trials, and certain contractor costs may become Qualified Research Expenses (QREs) for the R&D Tax Credit.
How an AI R&D CTO replaces manual R&D Tax Credit prep while strengthening technical documentation:
A modern AI R&D CTO (or AI Chief Technology Officer) can support plastics and composites companies by unifying Technology Radar insights with R&D Tax Credit execution—without relying on purely manual, after-the-fact recollection.
On the FUND side, an AI R&D CTO can help smaller companies and growth-stage manufacturers:
– Identify Qualified Research Activities tied to resin substitution, process-window optimization, tooling optimization, warpage reduction, and cure-process development
– Map experiments to the IRS 4-part test with clearer descriptions of technical uncertainty and advancement
– Calculate and substantiate Qualified Research Expenses (wages, trial supplies, qualifying contractor work)
– Conduct technical interviews and generate consistent project narratives
– Produce time surveys aligned to real project phases
– Assemble an R&D Study that is audit-ready, including contemporaneous documentation
– Support Form 6765 preparation workflows alongside your tax team
This is where R&D Tax Credit Services evolve: instead of chasing information at year-end, companies can build a repeatable evidence trail that supports IRS compliance requirements while reducing disruption to engineering.
The result is practical: stronger claims, fewer gaps, improved Business Cash Flow, and measurable Tax Savings through R&D Tax Credits or an R&D Tax Credit Refund when applicable.
Turning your Technology Radar into a self-funding innovation engine:
When GUIDE, SOLVE, and FUND work together, your Technology Radar stops being “nice to have” and becomes a compounding advantage. External intelligence guides smarter experiment selection; experiments resolve real technical barriers; and eligible experimentation can be captured through the R&D Tax Credit to help fund the next wave of trials.
This is the core SHAIN positioning: an AI R&D CTO democratizes innovation by helping startups, micro businesses, and small companies recover R&D Tax Credits while gaining access to technical leadership and innovation intelligence previously available only to large enterprises.
To learn more about how an AI R&D CTO can enhance knowledge to world-class standards while seamlessly gaining R&D tax credits—and to get an estimate of your potential R&D Tax Credit—select the button below.